


 Equity management

 Equity management
- Fund management

 Fund management
 - Fund managementFund management
- Fund managementFund management



Technically, the debt equity ratio formula is total interest-bearing debt divided by total shareholders' equity. In this article you’ll learn why both versions exist, which one to use, and how to calculate it accurately so you can defend the number in any lender or investor conversation.
The debt-to-equity ratio is total interest-bearing debt divided by total shareholders' equity. It measures what fraction of a company's financing comes from creditors versus owners.
A higher ratio signals more reliance on borrowed money and greater financial risk. Lenders review this ratio before extending credit; investors use it to assess balance-sheet risk before committing capital.
The ratio also connects to your equity dilution picture over time. As you raise equity rounds, your equity base grows and your ratio shifts.
The debt-to-equity ratio matters because each stakeholder or creditor uses the ratio differently to assess the health of the business.
Lenders use it to decide whether to extend credit and on what terms. Loan covenants often reference leverage ratios directly, so the number can trigger consequences if it drifts too high. Investors use it to gauge how much risk sits on the equity side of the balance sheet.
For founders and CFOs, the ratio is a planning tool. It tells you how much room you have to take on debt before lenders get nervous, and it frames conversations about whether to fund the next stage with equity or borrowing.
The canonical debt equity ratio formula is:
Debt-to-equity ratio = Total debt / Total shareholders' equity
However, some business-banking and SME sources define the ratio as total liabilities divided by equity, which folds in trade payables, accruals, and deferred revenue.
Debt-to-equity ratio = Total liabilties/ Total shareholders' equity
Think of it as two views:
Simply put, lending and capital-structure analysis calls for interest-bearing debt. A broad solvency check can use total liabilities instead.
If it carries interest or a fixed payment schedule like debt, it belongs in the numerator. These include:
Exclude these operating liabilities, even though they appear as liabilities on the balance sheet:
Total shareholders' equity is the residual left after you subtract liabilities from assets. It typically includes common stock, additional paid-in capital (APIC), retained earnings, and accumulated other comprehensive income.
In a broad corporate-finance calculation, use total shareholders' equity.
In lender or credit analysis, narrow the denominator to common shareholders' equity and strip out preferred stock and non-controlling interests.
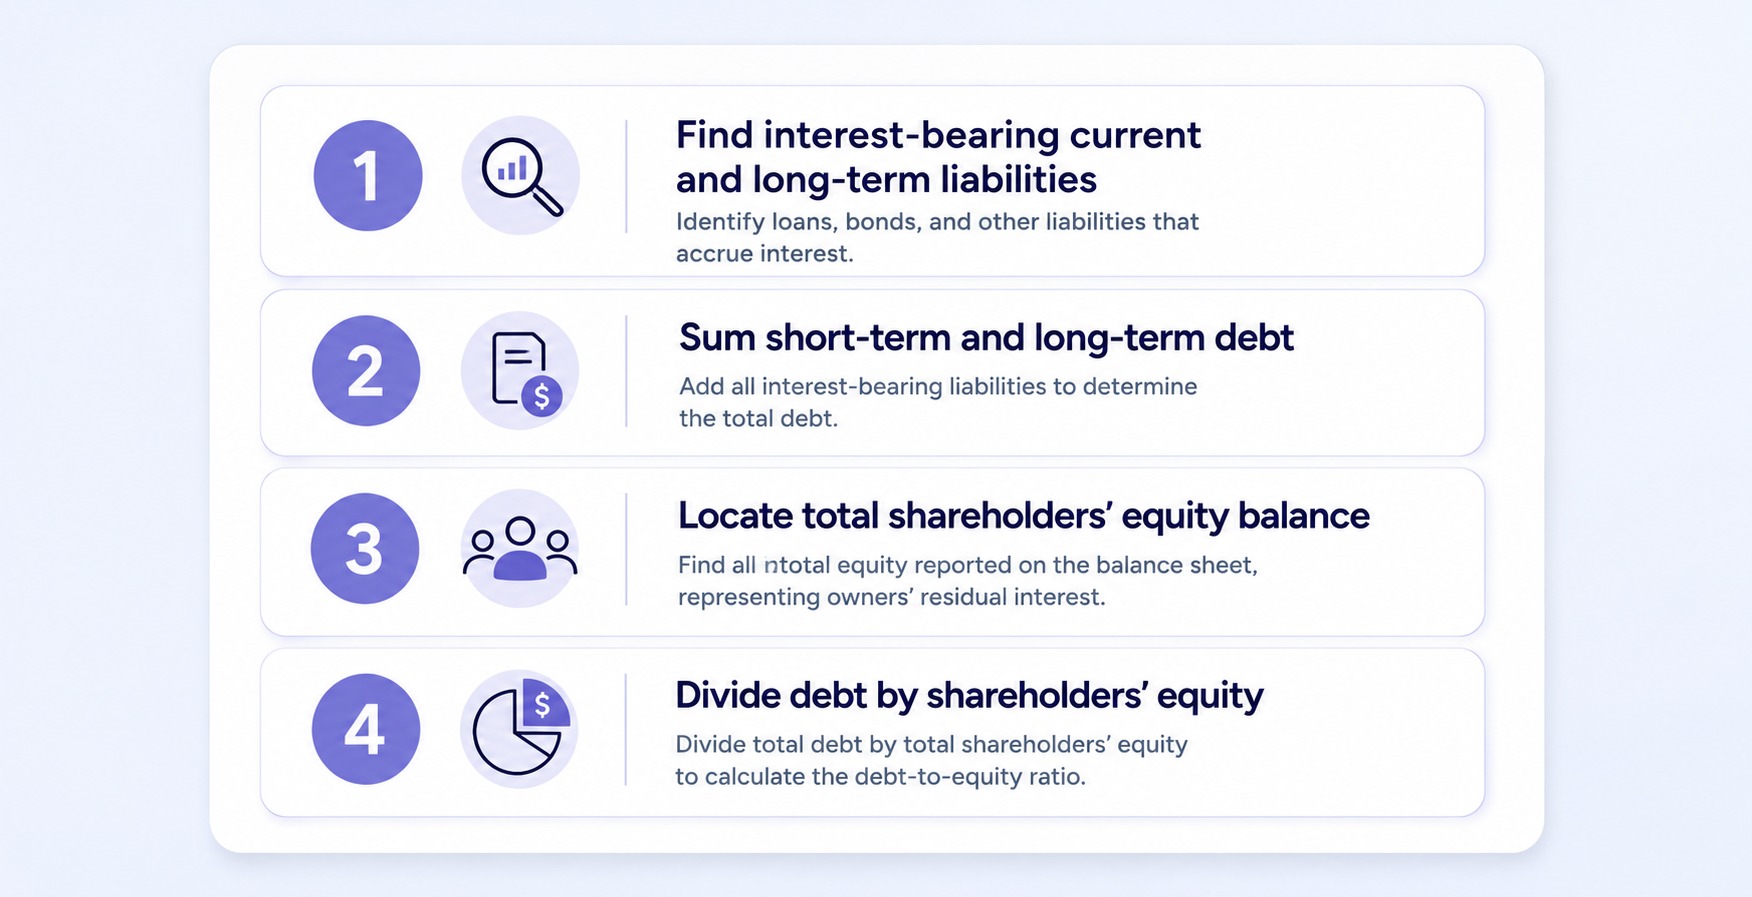
Calculating the debt-to-equity ratio from a balance sheet takes four steps. Following them prevents the most common error: mixing operating liabilities into the numerator. The result is the capital-structure ratio that lenders and investors actually use.
Here's a worked example. Consider a hypothetical Series B SaaS company in Austin with the following simplified balance sheet.
Using the capital-structure formula, you add the interest-bearing debt only: $2M plus $6M equals $8M. Divide by $10M in equity, and the ratio is 0.8. You leave out the $3M in payables and deferred revenue because those are operating liabilities, not debt.
Using the total-liabilities version instead, you'd add all $11M in liabilities and divide by $10M, producing 1.1. Same company, two different numbers, two different questions. That's the whole reason sources disagree.
Debt and equity can empower growth but carry very different obligations. Debt must be repaid on a schedule with interest, regardless of how the business performs. Equity carries no repayment obligation, but it dilutes ownership and gives investors a claim on future value.
Debt is usually cheaper because interest is tax-deductible and lenders take less risk than equity holders. But debt adds fixed payments that strain cash flow in a downturn. Equity absorbs risk without fixed payments, which is why early-stage startups with no operating history lean heavily on it.
The D/E ratio captures the outcome of these choices in one figure. When you raise a priced equity round, your ratio drops as equity grows. When you take on venture debt or a term loan, it rises. Watching the ratio move helps you keep the funding mix deliberate rather than accidental.
A healthy debt equity ratio depends on your industry, not a universal number. Among non-financial companies, a ratio below 1.0 is considered conservative, 1.0 to 2.0 is moderate, and above 2.0 starts to look aggressive. Capital-intensive and financial sectors operate far above that by design, so context is everything.
Some sources cite a general heuristic of 2.0 or lower as acceptable, and practitioner guidance sometimes puts 2.0 to 2.5 in an acceptable range for stable, cash-generating businesses. Treat these as starting points, not rules. The only meaningful comparison is against your own sector.
Industry averages make the point clearly. The figures below reflect FullRatio's published industry-average D/E data.
Banks and other financial institutions typically run D/E well above 2.0 because their business is taking deposits and making loans. Regulators monitor them with specialized capital ratios rather than the plain D/E used for operating companies. Reading a bank's D/E against a biotech's tells you nothing useful.
A high D/E ratio isn't automatically bad, and a low one isn't automatically safe. A high ratio signals more financial risk and more fixed obligations, but it can also reflect cheap, tax-advantaged capital funding a proven, cash-generating model.
A low ratio signals conservatism, but a pre-revenue startup can still be risky at a low ratio if there's no cash flow to service any debt at all.
Watch for two common distortions. Large share buybacks reduce equity through treasury stock, which mechanically pushes the ratio higher even if the business hasn't changed. Sustained losses erode retained earnings, shrinking equity and inflating the ratio the same way.
Negative equity breaks the ratio entirely. When accumulated losses or heavy buybacks push equity below zero, the D/E ratio turns negative and stops being meaningful. A negative ratio generally signals possible financial distress.
In that case, switch to alternatives:
Startups add their own wrinkles. Convertible notes count as debt until they convert. A SAFE (Simple Agreement for Future Equity) is a convertible investment instrument that grants an investor the right to receive equity at a future priced round, typically without a maturity date or accruing interest.
SAFEs usually sit in equity or mezzanine equity depending on their classification. Unexercised employee options don't count as debt, so the D/E ratio tells you little about future dilution.
Investors and lenders use four analytical lenses, peer comparison, trend direction, coverage ratios, and debt quality, to turn a raw D/E ratio into a credit or investment decision. A number without this context rarely tells them enough; the framework below is what makes it actionable.
You can run the same process yourself: calculate the canonical ratio, normalize for leases and preferred stock, and benchmark against peers. Then stress-test with coverage ratios and explain the drivers. That structure turns a raw number into a story you can defend in a fundraise or credit conversation.
As you raise, your equity base shifts with every round, which moves your leverage picture right alongside it. Accurate cap table data and scenario planning keep that picture reliable when it matters most. Companies often move off fragmented spreadsheets to get that clarity, with better audit trails and cleaner investor scenario analysis.
See how Qapita helps you stay ready for every raise, valuation, and audit. Book a demo.
A higher ratio signals more financial risk and greater reliance on debt; a lower ratio indicates more equity funding. Compare your result to industry peers, track it across multiple periods, and pair it with an interest coverage ratio to confirm that cash flow can service all outstanding debt.
Use interest-bearing debt for capital-structure analysis: short-term loans, notes payable, the current portion of long-term debt, long-term debt, bonds, and finance lease liabilities. Exclude accounts payable, accrued expenses, and deferred revenue because these are operating liabilities. A broad solvency check can use total liabilities instead.
Not necessarily. Zero debt means no leverage risk, but it can also mean a company isn't using cheap, tax-advantaged capital to fund growth — which may signal underuse of available financing options rather than financial strength. For early-stage startups, a very low or zero D/E ratio is common and expected since most funding comes from equity rounds, not a sign of unusual conservatism.
SAFEs generally sit in equity or mezzanine equity, not debt — they don't accrue interest and typically don't have a maturity date, which is what excludes them from the numerator. That said, classification can depend on the specific SAFE terms, so it's worth confirming with your accountant how your SAFEs are actually classified on your balance sheet before assuming they're excluded.








.png)
.png)