

 Equity management

 ESOP Management
- Fund management

 Liquidity Solutions
 - Fund managementESOP Consulting
- Fund managementFund Management


ESOPs are strategic instruments that influence talent retention, leadership continuity, and long-term value creation. Conversations around ESOPs are no longer confined to HR discussions, they now feature prominently in boardrooms and investor meetings as critical components of capital allocation and ownership planning.
In today’s data-driven corporate landscape, decisions around employee ownership and equity are no longer made in isolation. Benchmarking brings objectivity to ESOP decision-making, helping boards and investors evaluate whether equity incentives are competitive, sustainable, and aligned with both market practices and shareholder interests. Rather than relying on legacy practices, benchmarking provides a fact based and data driven perspective on how a company’s ESOP program compares to market practices.
The importance of ESOP benchmarking has increased significantly in recent years due to high demand of key talent across industries, increased competitiveness, increased investor involvement in decision making, evolving governance standards and greater transparency around ESOPs. As companies scale and prepare for milestones such as IPOs, investors and boards increasingly expect ESOPs to be supported by credible market data to demonstrate discipline in capital allocation, fairness in employee rewards and alignment with long‑term value creation. In a dynamic talent market and a tightening regulatory and disclosure environment, benchmarking has become essential to ensure ESOP structures remain defensible, competitive and resilient across different stages of the company lifecycle.
ESOP benchmarking data provides comparative insights drawn from peer companies across industries, stages of growth and geographies. Peer companies for benchmarking are typically evaluated and identified based on relevant comparability factors such as industry alignment, business model, market share as well as similarity in company size and scale to ensure meaningful and defensible comparisons. Typically, ESOP benchmarking focuses on a set of core design parameters that determine how effective and defensible an equity incentive plan truly is.
This data typically covers metrics such as:
Benchmarking assesses the mix of equity instruments used by peer companies, such as stock options (ESOPs), restricted stock units (RSUs), phantom equity/CSARs, employee stock purchase plans (ESPPs) or a combination of one or more of these instruments, to understand prevailing sector preferences.
This is a key diligence point, as structure impacts control, compliance risk, funding obligations and transaction execution, both at the time of acquisition (secondary/ primary) and at the time of exercise.
Benchmarking highlights how broadly equity is distributed, limited to senior leadership or extended across critical talent layers, helping assess inclusivity and alignment with retention strategies.
Options pricing relative to peers provides insights intoemployee motivation and value creation, accounting costs and potential risks such as future repricing.
Vesting design is benchmarked across peers to assess the appropriateness of vesting periods, vesting schedules and vesting conditions.
The length of the vesting period indicates expected tenure and retention horizons, while the choice between equated, back-ended, or hybrid vesting schedules reflects how companies balance early retention risk with long‑term commitment. Vesting conditions, whether time‑based, performance‑linked or a combination of time & performance are evaluated to ensure alignment with value‑creation milestones.
This evaluates how and when employees can exercise their options and meaningfully realise value from their equity. Factors such as the frequency and clarity of liquidity windows and the presence of cashless exercise mechanisms are critical in determining perceived value and participation.
Benchmarking validates whether the ESOP pool size falls within acceptable market ranges. This is critical for modelling future dilution across funding rounds and ensuring no surprises at exit.
ESOP benefit may be benchmarked as a percentage of total compensation to assess whether equity represents a meaningful employee wealth creation opportunity and remains competitive and attractive with industry norms. This also helps companies efficiently balance cash compensation and long‑term equity incentives, while maintaining market competitiveness
For Board members and Investors, ESOP benchmarking is not about replicating market norms, it is about ensuring that equity incentives support execution, protect ownership economics and remain credible through scale, capital raises and eventual liquidity.
Investors pay close attention to ESOP structures because equity allocation directly affects ownership outcomes and exit economics. In investor meetings, founders and leadership teams are often asked:
Having robust benchmarking data enables management teams to respond with confidence. It signals that ESOP decisions are intentional, data-driven and aligned with investor expectations.
Source note: The trends and observations presented in this section have been collated from publicly available disclosures, including scheme documents, ESOP disclosures, annual reports and annual returns published on the respective companies’ websites.
The banking sector has seen a gradual recalibration in the design of equity-linked long-term incentives, shaped by evolving governance expectations, regulatory guidance and the imperative of shareholder alignment. In this section, we review instrument trends across four leading private sector banks, Axis Bank, ICICI Bank, HDFC Bank, and Kotak Mahindra Bank.
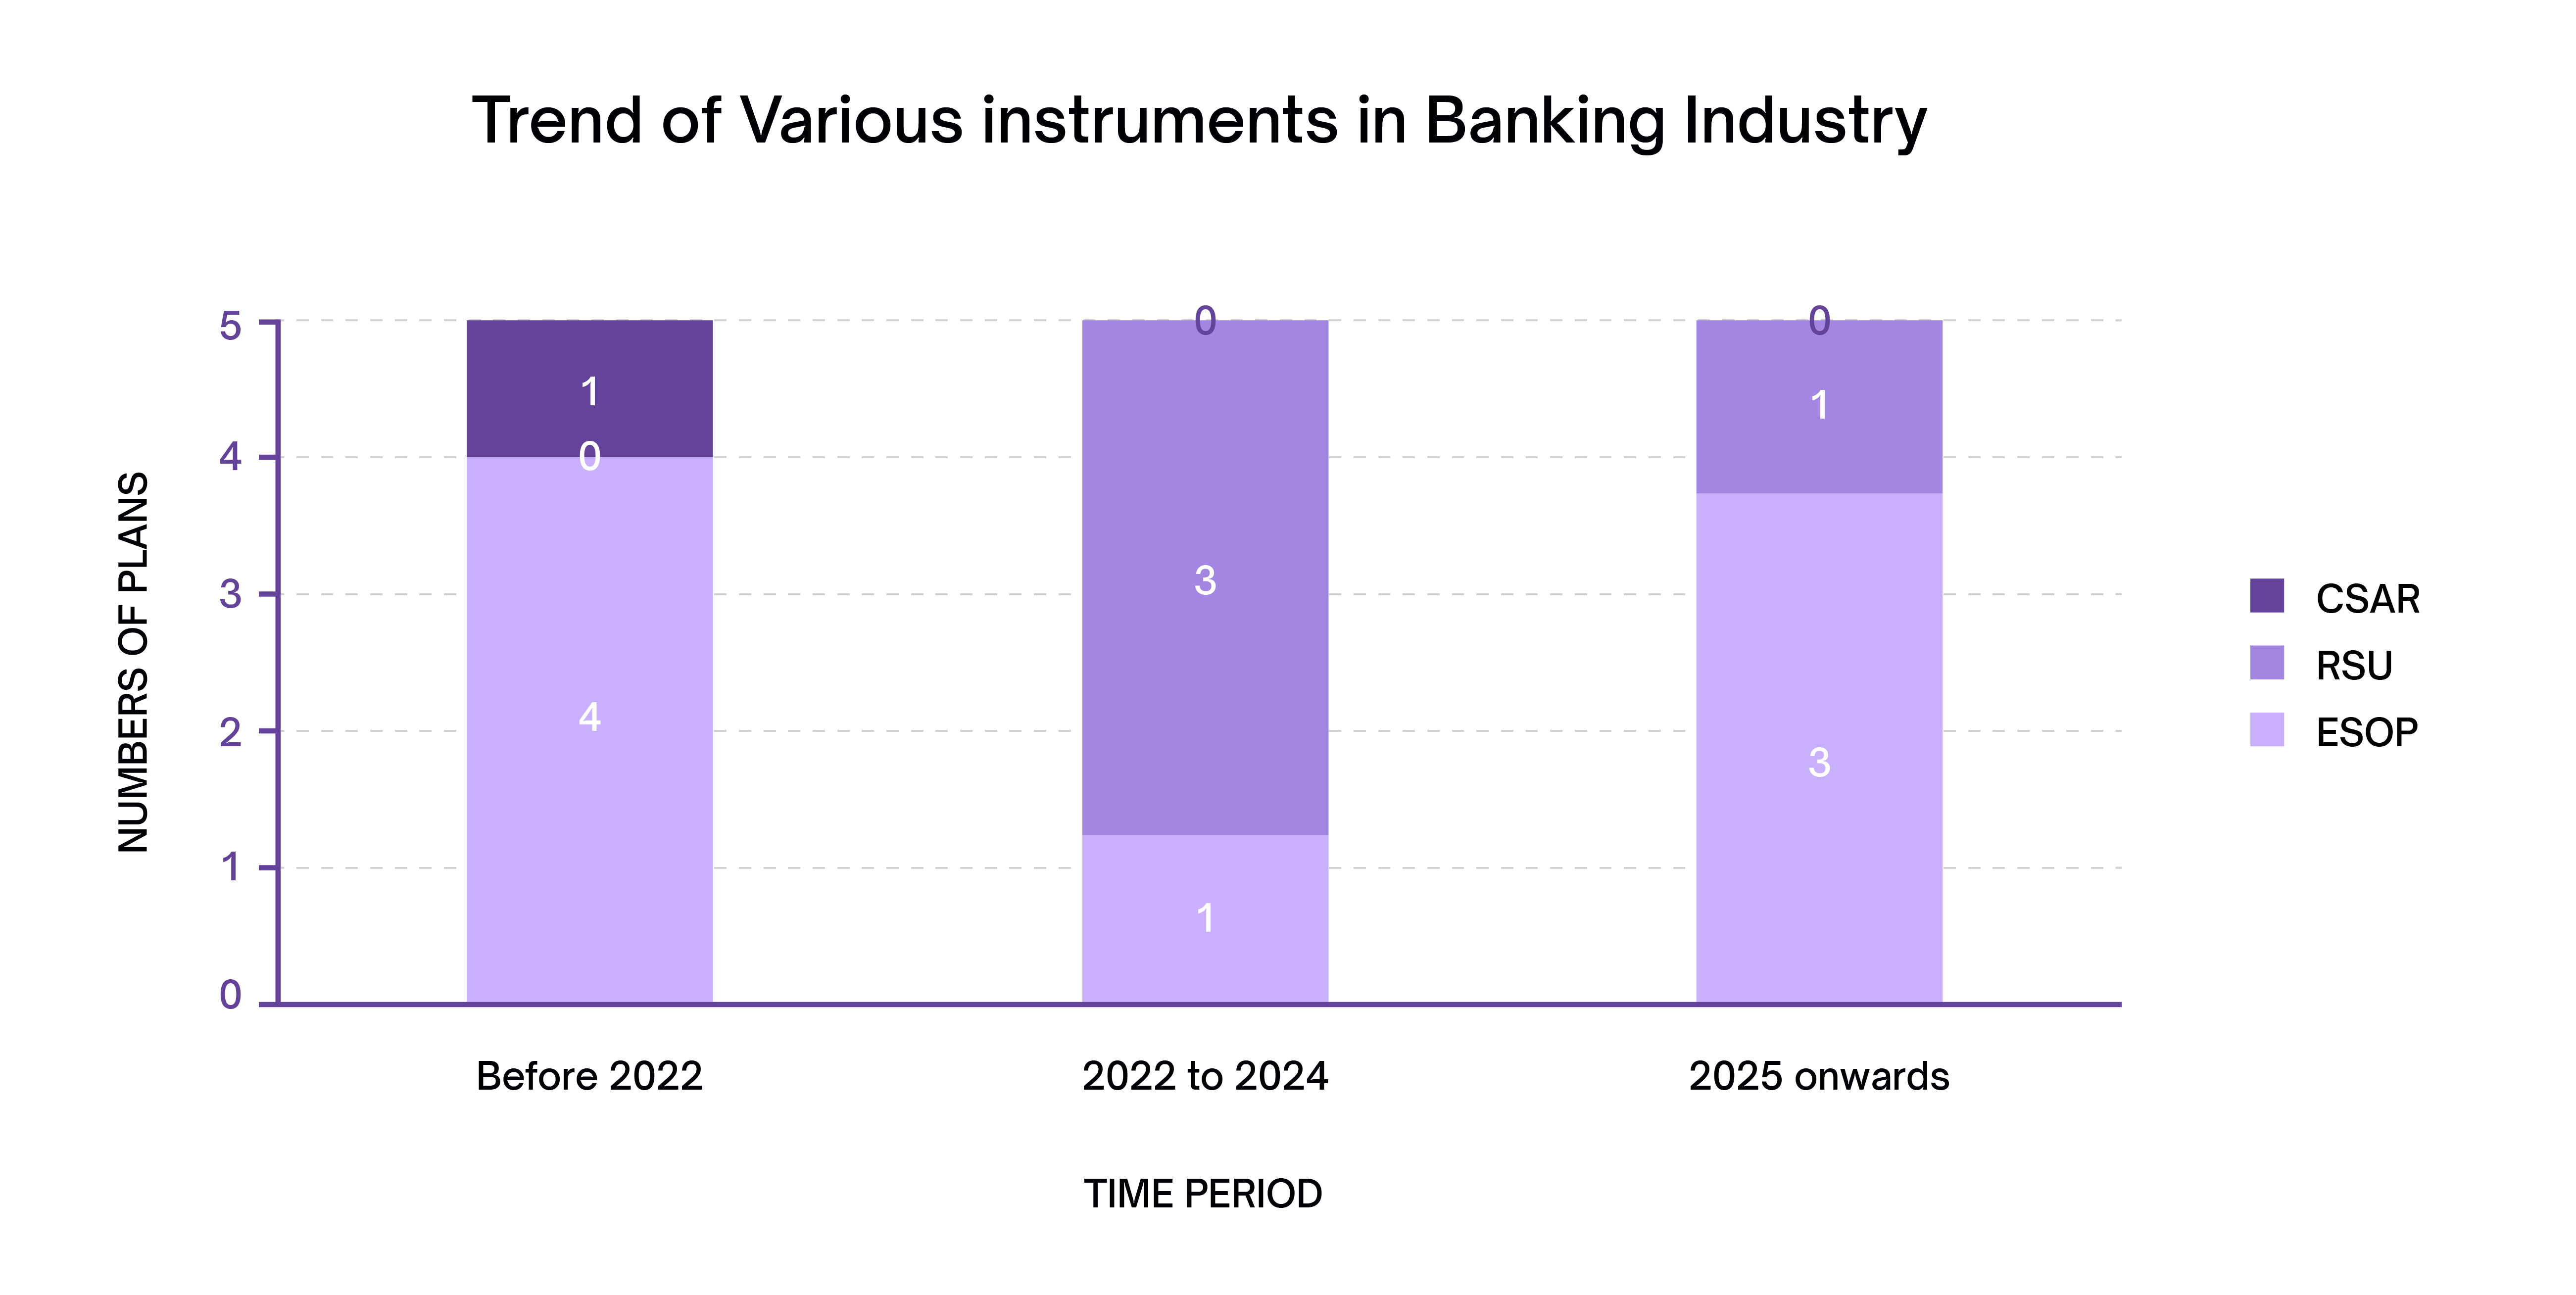
While ESOPs may be used selectively for leadership roles, RSUs may be used as an instrument due to their scalability and strong performance linkage.
The largely parallel evolution of long‑term equity incentive design across Axis Bank, ICICI Bank, HDFC Bank and Kotak Mahindra Bank demonstrates that banks tend to move in step with one another, guided by shared regulatory expectations, governance norms and market practices. Such convergence reinforces the importance of external benchmarks, not as a tool for uniformity, but as a reference point to ensure competitiveness, credibility and alignment with prevailing industry standards while shaping compensation outcomes.
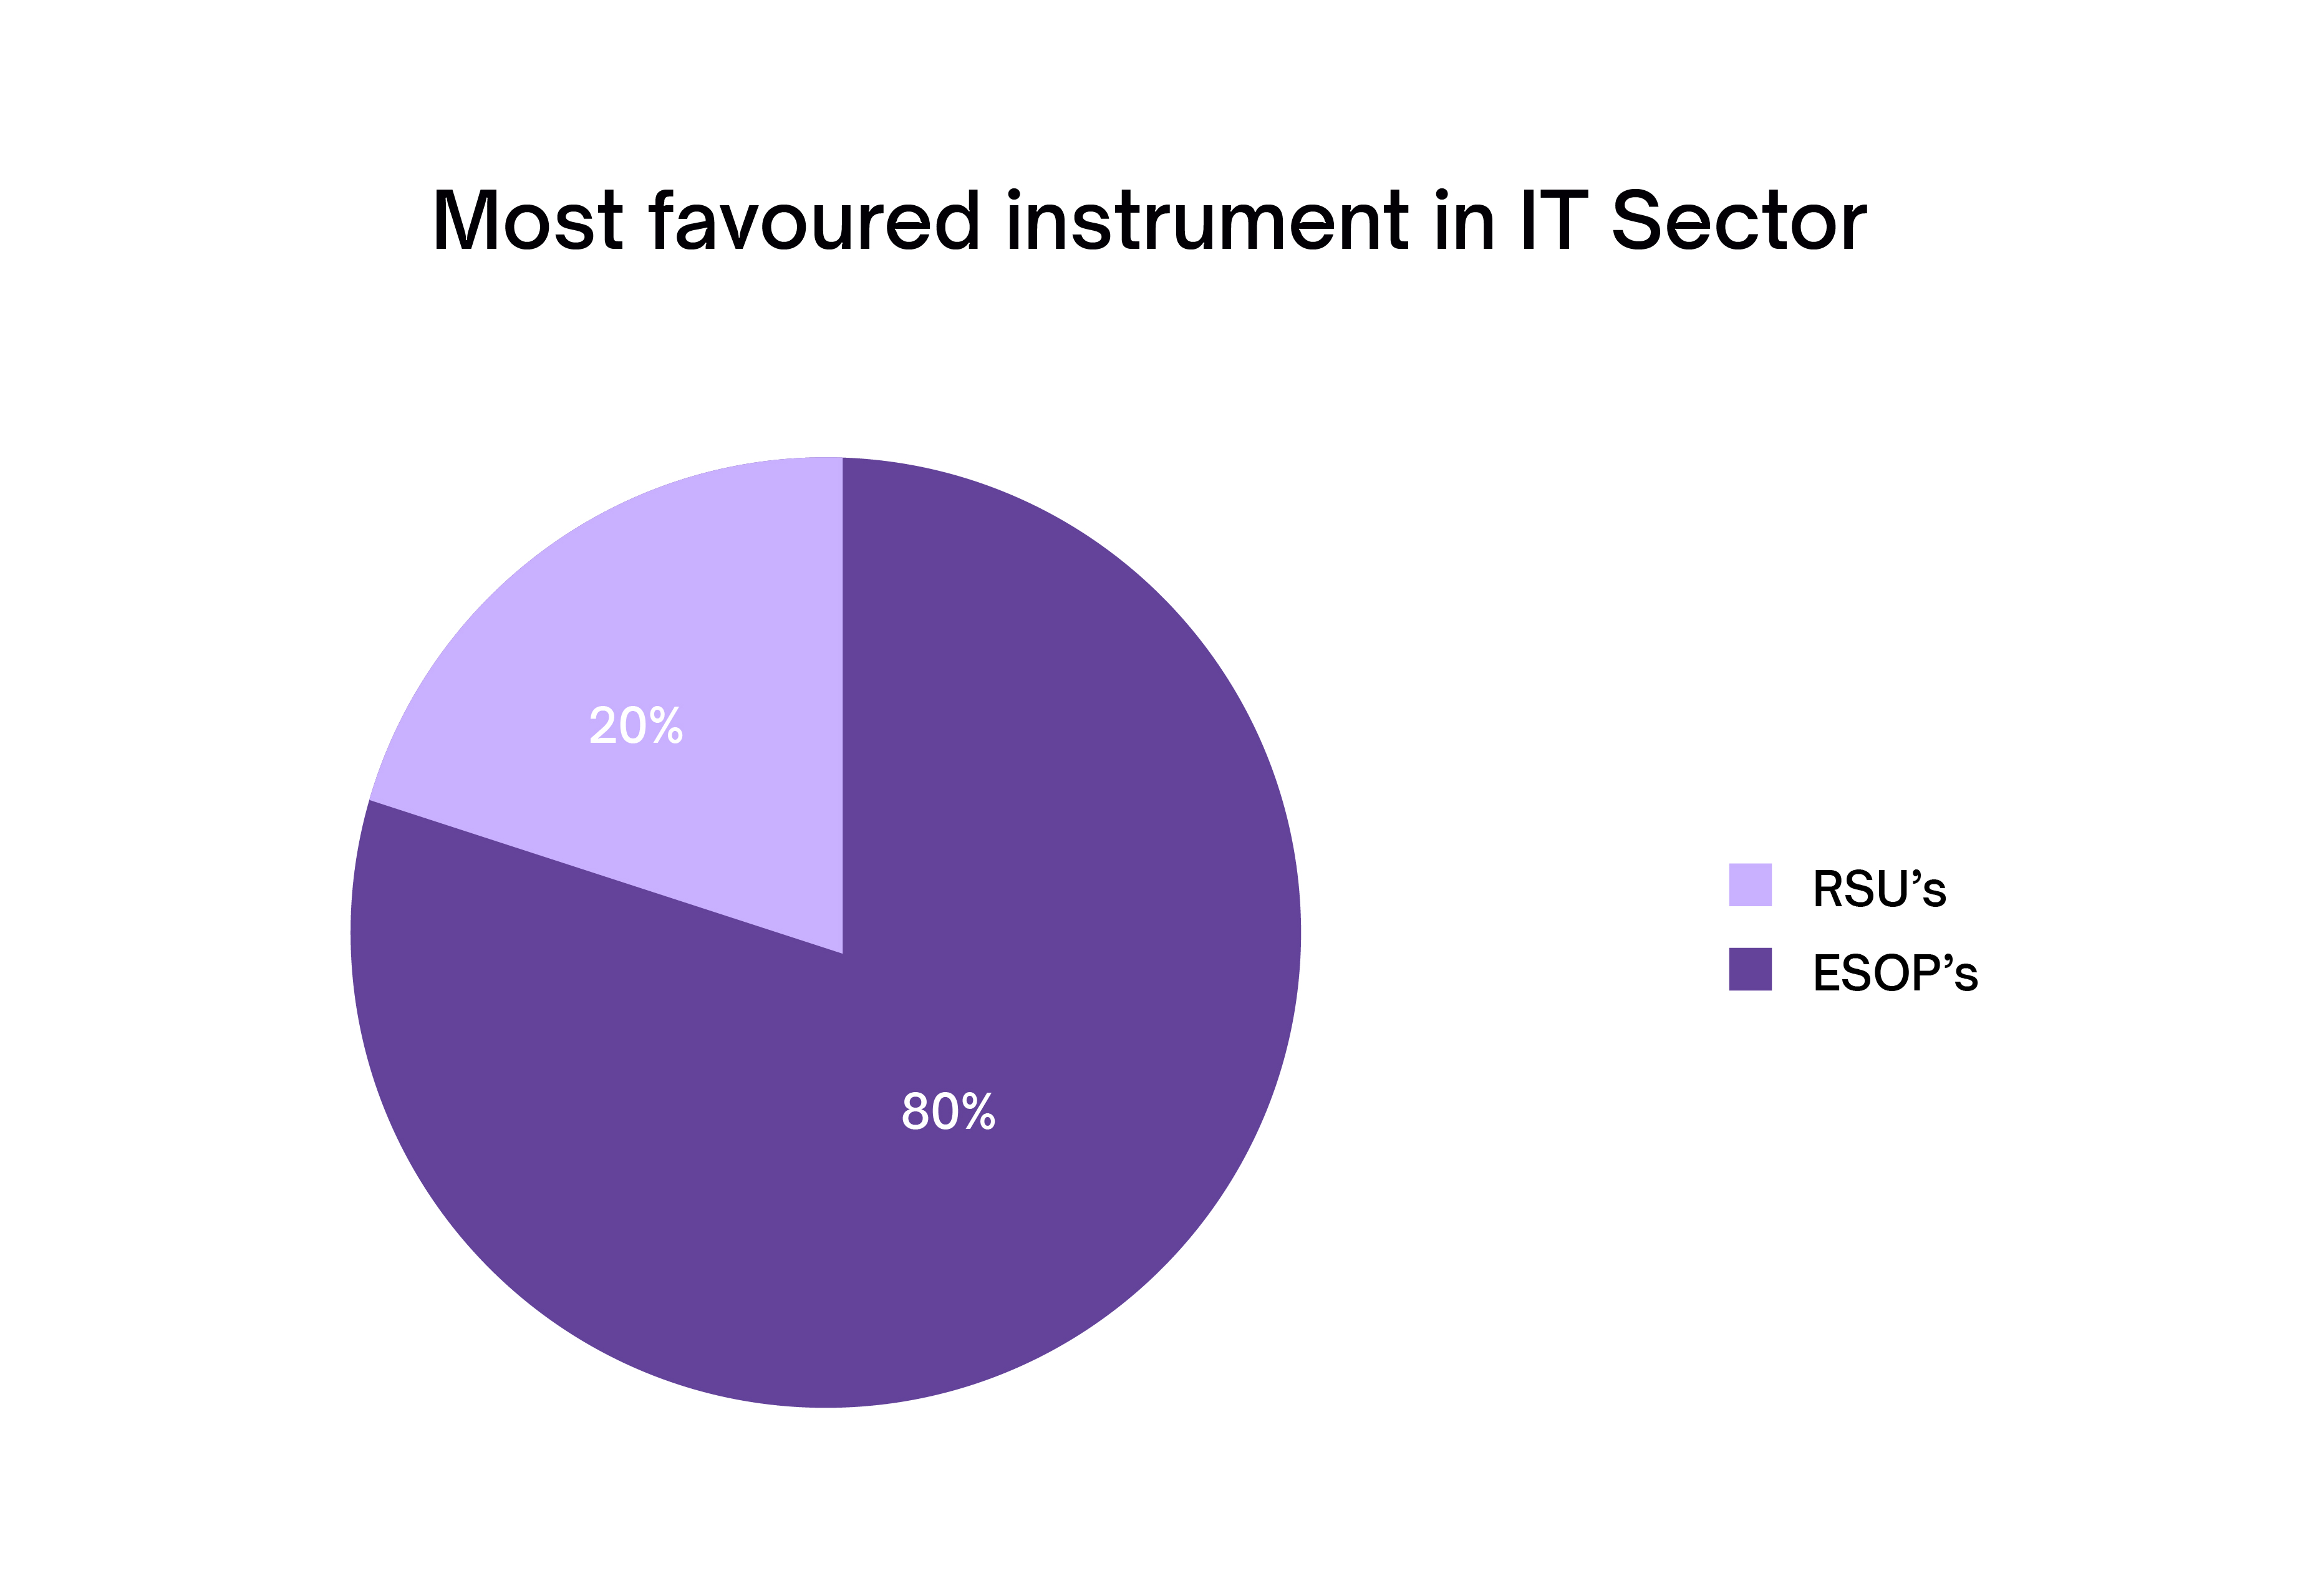
Established IT companies such as Infosys, HCL Technologies, Wipro, and Tech Mahindra have used RSUs from the very beginning to reward employees across levels. These organisations operate in highly competitive, performance-driven environments where long-term incentives are closely linked to business outcomes, stock performance and individual contributions.
RSUs offer several advantages for IT companies, such as:
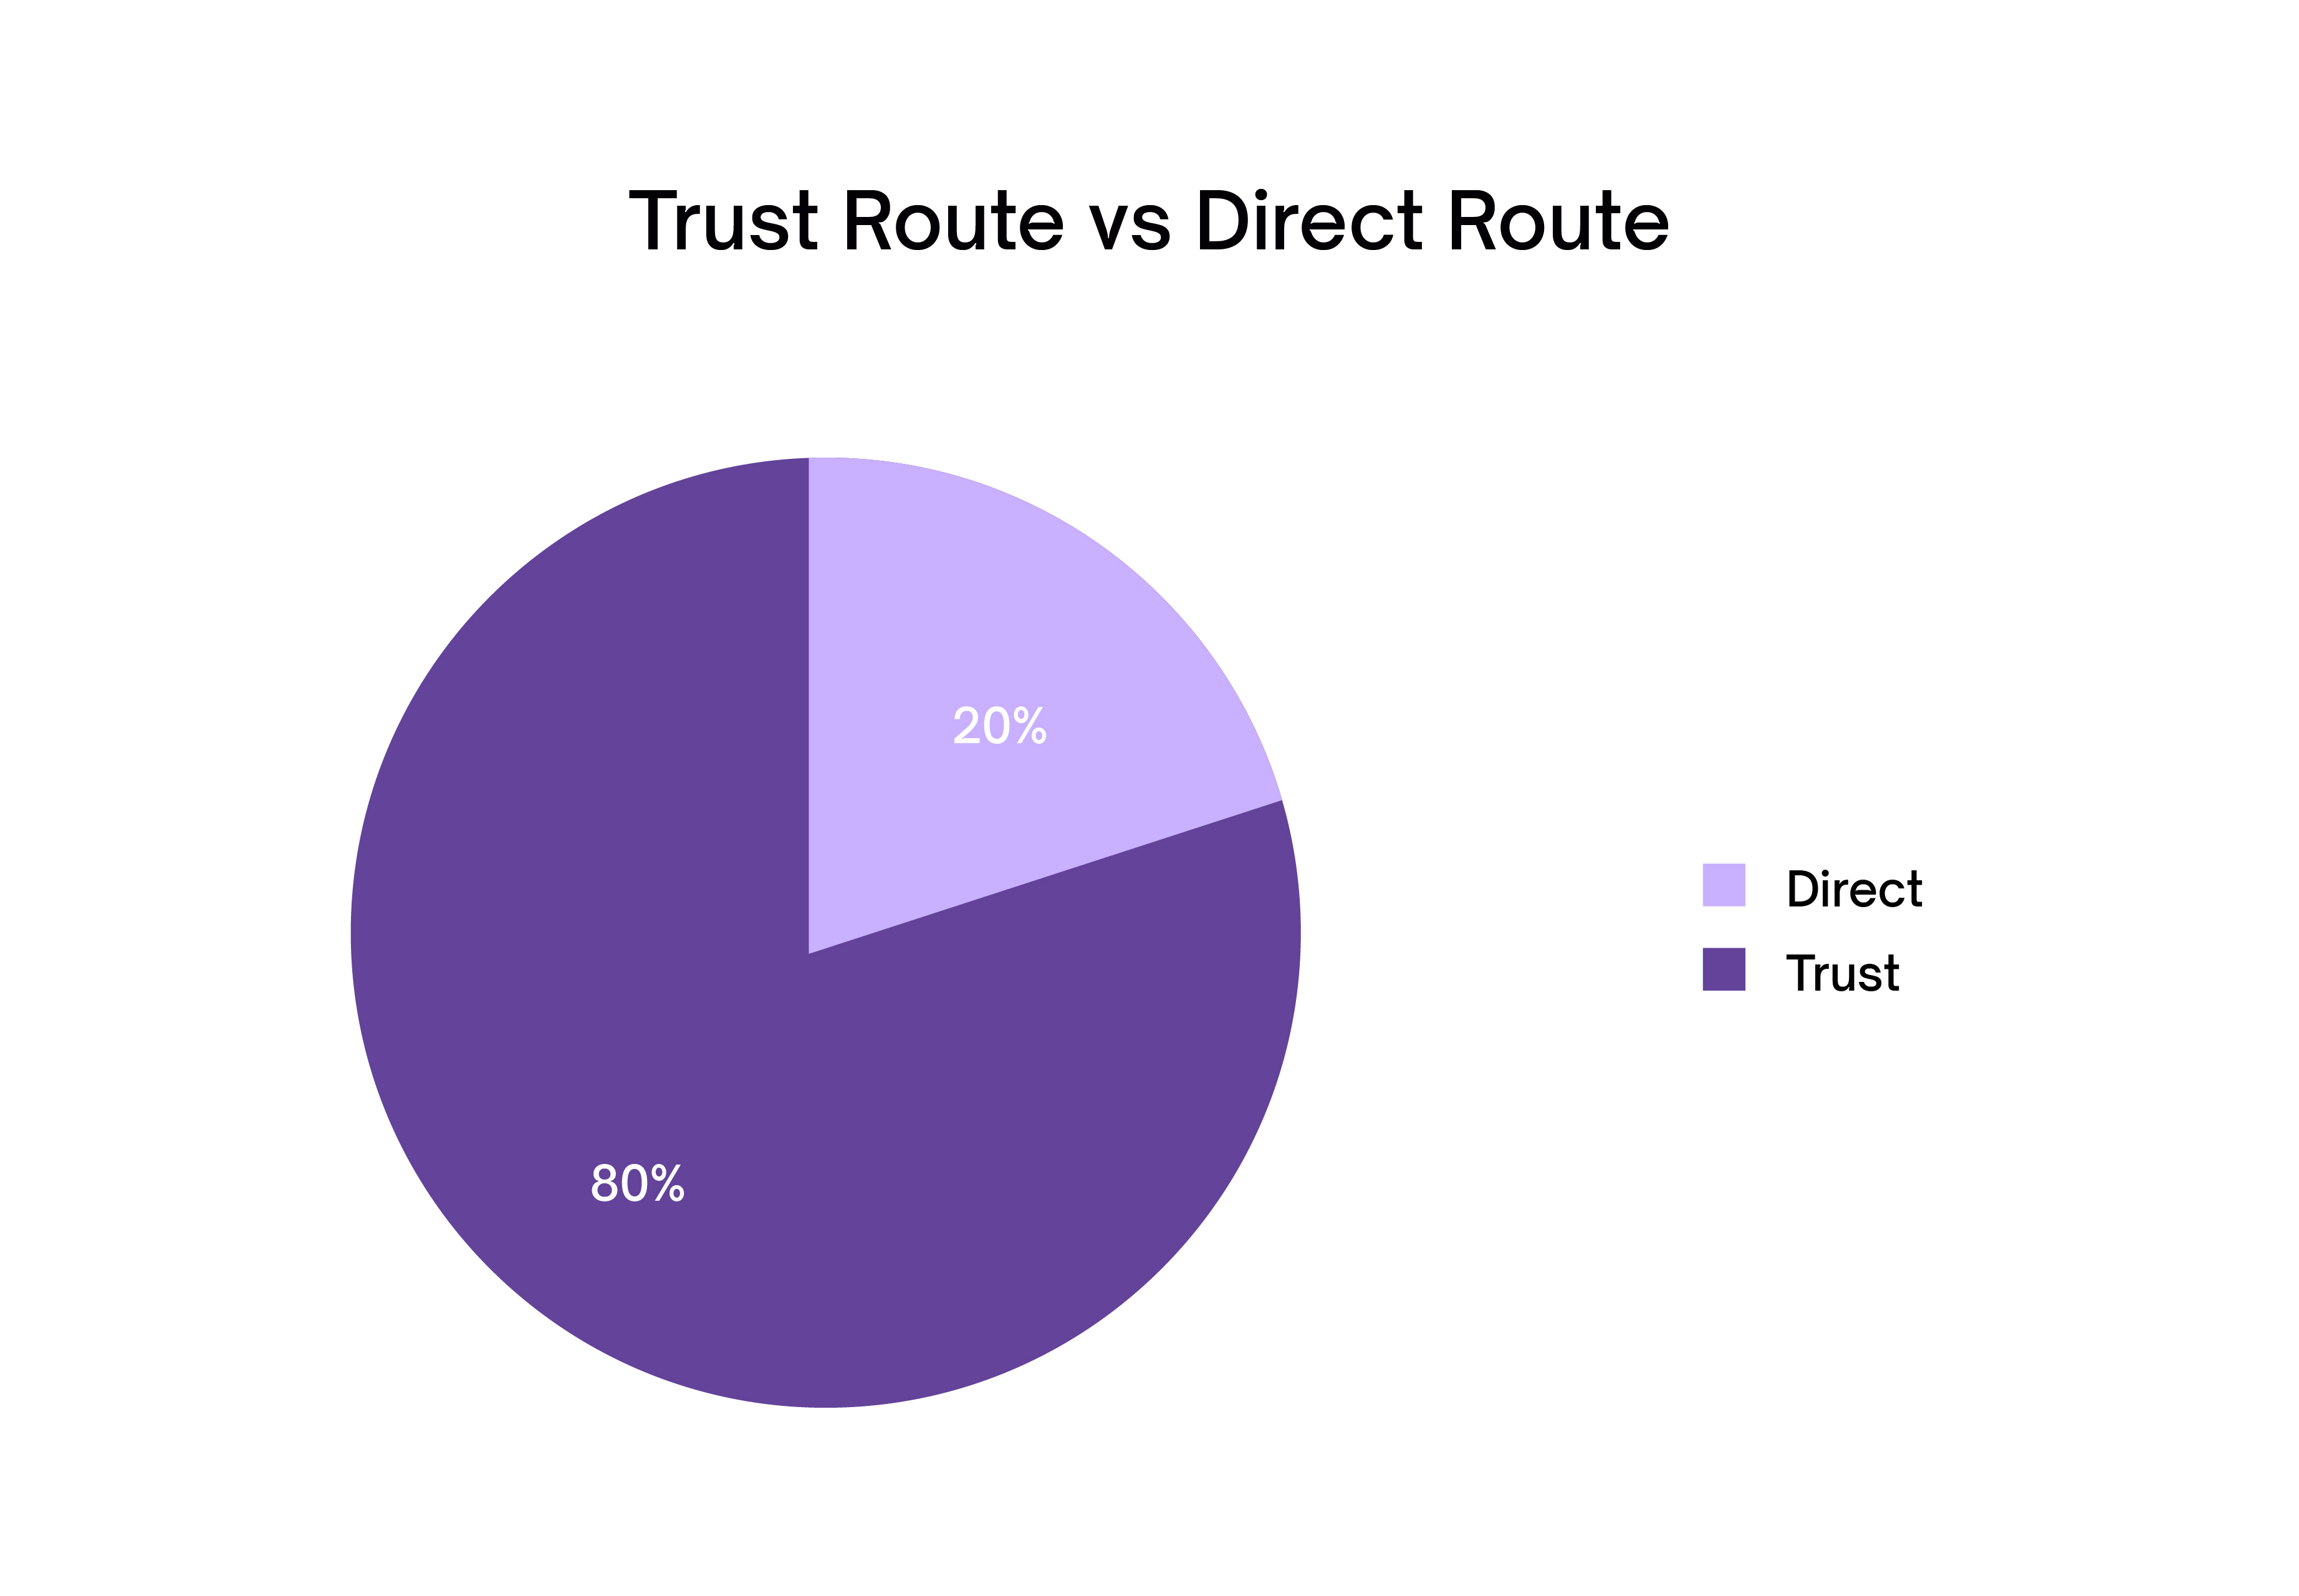
The benchmarking data indicates a strong preference for the trust route of implementation among IT companies. This structure enables firms to efficiently manage large volumes of equity awards across multiple vesting cycles while maintaining tighter control over liquidity events and dilution management.
For IT organisations operating at scale, this approach simplifies exercise of options at various points of time, easier to create beneficial ownership structure for overseas employees and reduces administrative complexity, particularly in global compensation environments.
In this context, by leveraging benchmarking insights, organizations can confidently adopt instruments and implement structures such as the trust/direct route to support large-scale, multi-geography workforces. Ultimately, benchmarking provides a data-backed foundation for designing ESOP frameworks that balance employee value creation, administrative simplicity and shareholder expectations, making them both practical and defensible in long run.
.jpg)
Prominent developers such as Lodha Group, Oberoi Realty, Keystone Realtors (Rustomjee), Godrej Properties, Kolte Patil Developers and Kalpataru Limited have historically maintained very low equity dilution levels, typically capped at or around 2%. This reflects a clear strategic intent to preserve promoter control and long-term ownership value.
Key characteristics of ESOP practices in the real estate sector include:
Even where ESOPs are implemented, they are structured conservatively, with equity viewed as a scarce and powerful instrument rather than a broad-based reward mechanism.
Hence, benchmarking is essential to ensure that ESOP design aligns with sector-specific priorities, such as promoter control, limited dilution and selective talent retention. It enables companies to adopt a disciplined approach to equity allocation by validating conservative pool sizes and targeted grants, ensuring competitiveness without compromising ownership objectives.
Boards and management teams should proactively reassess Feasibility study for ESOP design, including but not limited to:
As companies scale and ownership structures become more complex, benchmarking enables boards and investors to assess whether equity incentives are competitive, disciplined and aligned with long‑term value creation. Well‑designed ESOPs, supported by robust market data, strengthen talent retention, protect ownership economics and enhance credibility across funding cycles and liquidity events.
Key Takeaways
Ultimately, effective ESOP benchmarking supports better decision‑making across the company lifecycle. When used judiciously, it ensures that equity remains a strategic lever for execution and alignment.
Benchmarking data only creates value when it leads to action. Qapita helps companies benchmark their ESOP, RSU, SAR, and phantom share programs against relevant peer groups, sector benchmarks, and stage-specific market norms, delivering structured data and clear recommendations that align your equity plan with what the market demands. Whether you are walking into a board meeting or a fundraise, Qapita ensures every equity decision you make is backed by evidence.